You can download the Zillow Price Kaggle datasets from https://www.kaggle.com/c/zillow-prize-1
For this exploratory study of property dataset, I used Spark to calculate the missing value percentage for each column. As you can see below, as many as 20 columns have greater than 90% null/empty values. Examples: storytypeid, basementsqft, yardbuildingsqft.
(Column Name, Missing Value Percentage)
(storytypeid,99.94559859467502)
(basementsqft,99.94546460106585)
(yardbuildingsqft26,99.91132972912857)
(fireplaceflag,99.82704774895761)
(architecturalstyletypeid,99.79696618369786)
(typeconstructiontypeid,99.7739862797244)
(finishedsquarefeet13,99.74300025760272)
(buildingclasstypeid,99.57694867743282)
(decktypeid,99.42731131438686)
(finishedsquarefeet6,99.26300165113625)
(poolsizesum,99.06338467186806)
(pooltypeid2,98.92553874642948)
(pooltypeid10,98.76260251767292)
(taxdelinquencyflag,98.10861320969296)
(taxdelinquencyyear,98.10854621288838)
(hashottuborspa,97.68814126410241)
(yardbuildingsqft17,97.30823588368953)
(finishedsquarefeet15,93.60857183916613)
(finishedfloor1squarefeet,93.20930438222749)
(finishedsquarefeet50,93.20930438222749)
(threequarterbathnbr,89.56085939481116)
(fireplacecnt,89.5271600021037)
(pooltypeid7,83.73789912090143)
(poolcnt,82.66343786733091)
(numberofstories,77.15177824593657)
(airconditioningtypeid,72.81541006901676)
(garagecarcnt,70.41196670124819)
(garagetotalsqft,70.41196670124819)
(regionidneighborhood,61.26238059075773)
(heatingorsystemtypeid,39.488452598253325)
(buildingqualitytypeid,35.06374913448503)
(unitcnt,33.75724444822604)
(propertyzoningdesc,33.71908976801352)
(lotsizesquarefeet,9.248875374888994)
(finishedsquarefeet12,9.24666448033761)
(calculatedbathnbr,4.31834603648579)
(fullbathcnt,4.31834603648579)
(censustractandblock,2.5166009707167016)
(landtaxvaluedollarcnt,2.268947282559358)
(regionidcity,2.10520709214774)
(yearbuilt,2.0074922526570096)
(calculatedfinishedsquarefeet,1.8613387234495853)
(structuretaxvaluedollarcnt,1.8418091549123563)
(taxvaluedollarcnt,1.4253570175970458)
(taxamount,1.0468250716782062)
(regionidzip,0.46830766406596236)
(propertycountylandusecode,0.4112598849597868)
(roomcnt,0.3843941663202374)
(bathroomcnt,0.38395868709041925)
(bedroomcnt,0.3835567062628948)
(assessmentyear,0.38318822383766404)
(fips,0.38312122703307666)
(latitude,0.38312122703307666)
(longitude,0.38312122703307666)
(propertylandusetypeid,0.38312122703307666)
(rawcensustractandblock,0.38312122703307666)
(regionidcounty,0.38312122703307666)
(parcelid,0.0)
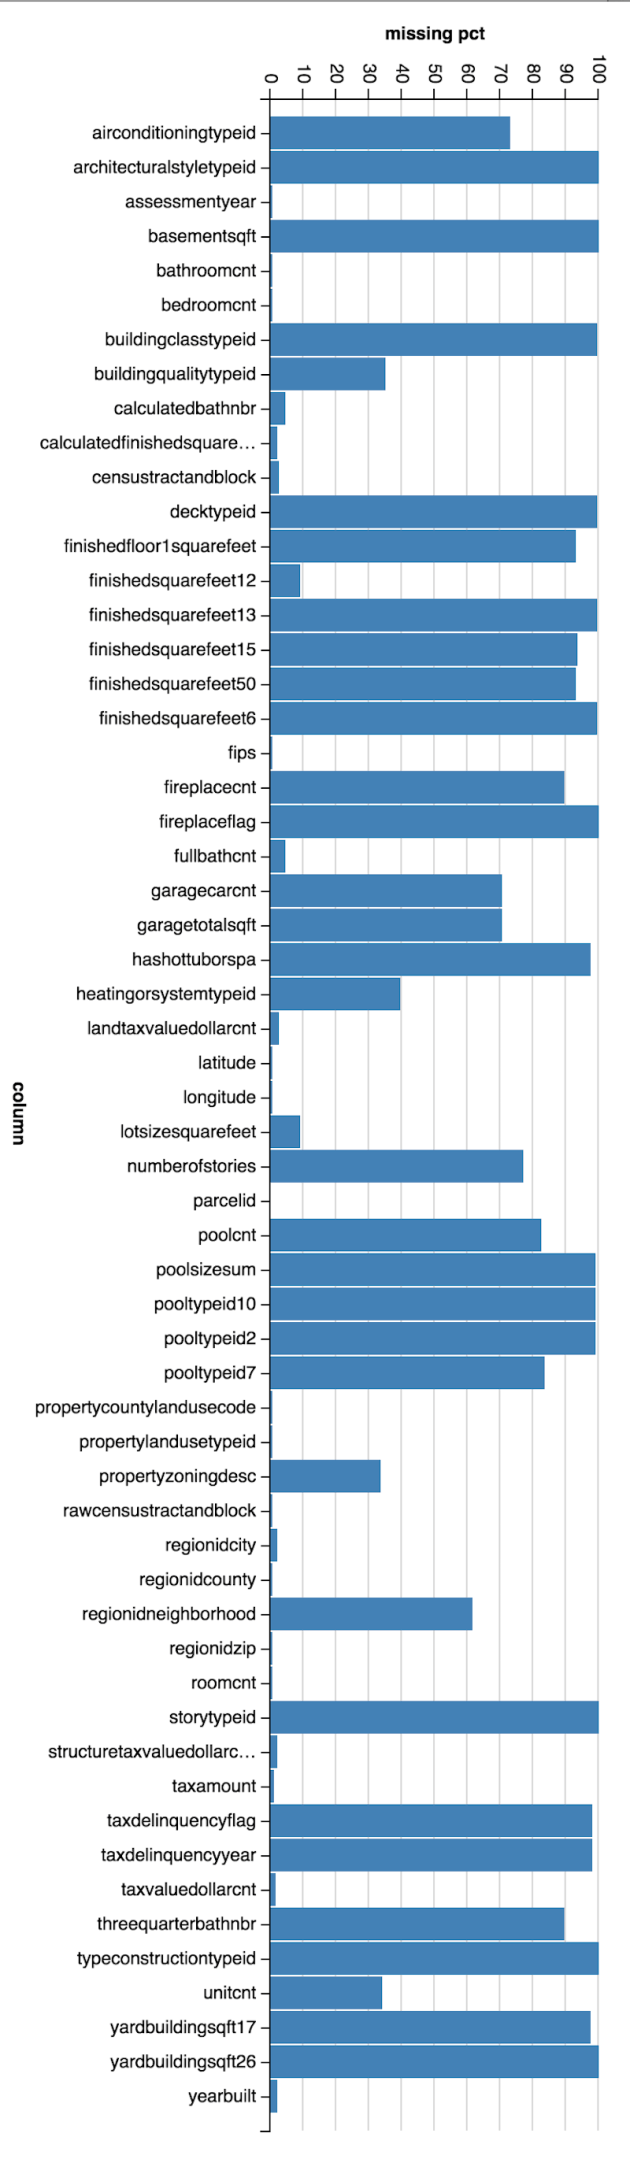
Now I have identified the good columns (italics bold, less than 10% empty values) and bad columns. The next step is to determine if we can apply some sorts of missing values imputation to any of those problematic columns.
A few missing value imputation techniques are available, such as using mean, median, or most frequent value as replacement value.
