When come to building a well balanced stock portfolio, it is desired to have different mixture of stocks, potentially from different sectors to minimize the risk. Clustering is a great tool to discover these different types of clusters. You can use different features to categorize these stocks, eg. historical prices, returns, etc.
I know I could have used python or R to run the clustering. But as a big data explorer, I decided to use Mahout and Spark to do the job. I will post my findings and experiences of using these tools in the upcoming posts.
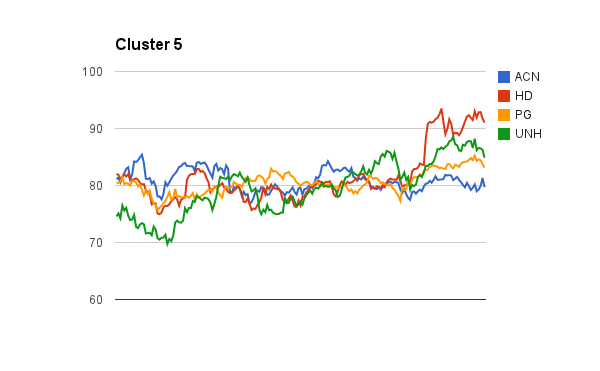
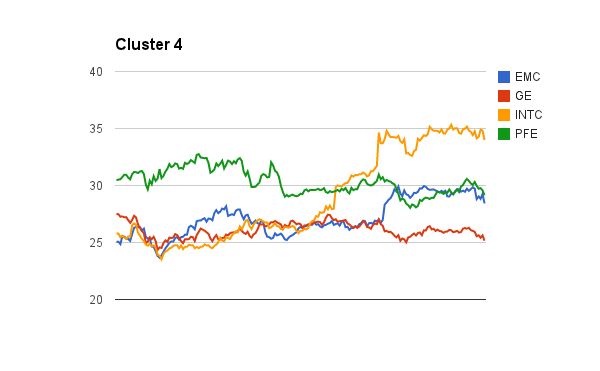
Here are the initial clusters found using the pre-clustering canopy algorithm in Mahout to determine the initial number of K clusters. I will perform the K-Means clustering algorithm next.


The tedious part of using Mahout clustering is you have to transform your data into sequence file format of mahout vector writables. I will share my codes soon.
Please check out my stock prediction model too 🙂 http://giantify.collective2.com/
To be continued…