Thanks to FiveThirtyEight, we can now play with some New York’s Uber trip datasets (apr 2014 to sept 2014)
https://github.com/fivethirtyeight/uber-tlc-foil-response
I wrote a simple Spark job to analyze the data and create some visualizations using Zeppelin to tell the story from the numbers.
First, lets find out the day of week distribution of New York’s Uber trips. From the table below, we can see that Saturday has the most number of trips, totaled 537,091 followed by Sunday, with 534,856 trips whereas Wednesday has the least number of trips.
Note: dayOfWeek [Saturday: 7, Sunday: 1, Monday: 2, Tuesday:3, Wednesday:4, Thursday:5, Friday:6]

Next, lets study the temporal pattern of Uber trips. With the data, I computed the hour distribution of Uber trips as shown by the bar chart below.

Without no surprise, the number of Uber trips peaked around 5 pm during the evening rush hour period. As we see from the chart, the traffic began to increase from 2pm till 9 pm. A smaller peak was found around morning rush hour from 6 am to 8 am. Another interesting observation is that midnight 12 am also has a significant high number of Uber trips.
Most number of trips at peak hour 5 pm

Least number of trips at 2 am


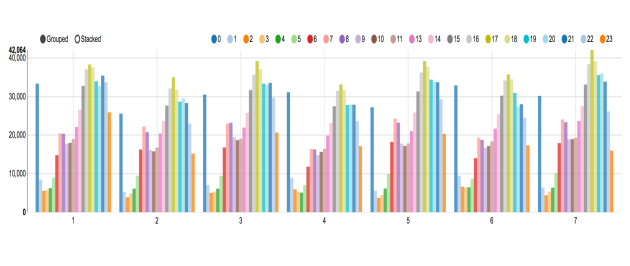
I also created the number of trips vs hour + day of week bar charts shown above to get a better understanding of hour distribution of trips for each of the day of week. Once again I used the following integers mapping to represent different day of week. Each color bar represents the number of Uber trips for the corresponding hour for the specific day of week.
Note: dayOfWeek [Saturday: 7, Sunday: 1, Monday: 2, Tuesday:3, Wednesday:4, Thursday:5, Friday:6]
As we can see from above, for group 2 which represents Monday, we have the least number of midnight trips, (dark blue bar, 0). Most people were going home earlier on Sunday night, resulted in the least number of mid night trips.
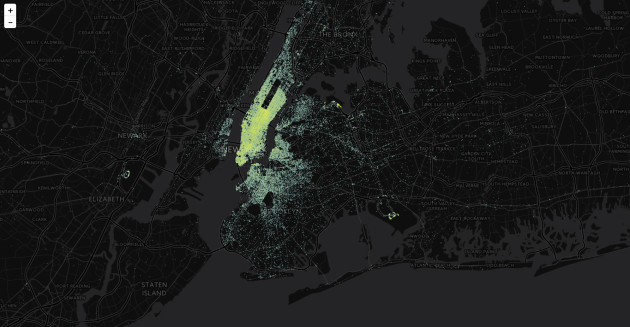
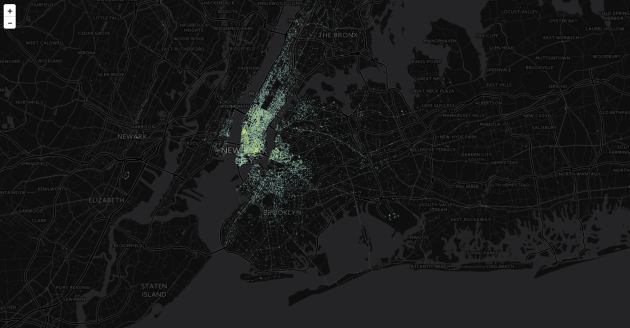
Next question we would like to answer is where are the hot spots with many Uber pickups. Using the NYC Open Data neighborhood shapefile for New York, we can group these pickups location by neighborhood and figure out these hotspots.
Identified popular hotspots
Manhanttan,3451299
Brooklyn, 595293
Queens,376066
Bronx,35522
Staten Island,1982

These are the hot neighborhoods with the most Uber’s pickups
1)Manhattan, Midtown-Midtown South
2)Manhattan, Hudson Yards-Chelsea-Flatiron-Union Square
3)Manhattan, SoHo-TriBeCa-Civic Center-Little Italy
4)Manhattan, West Village
5)Manhattan, Turtle Bay-East Midtown
6)Queens, Airport
7)Manhattan, Upper East Side-Carnegie Hill
8)Manhattan, Battery Park City-Lower Manhattan
With the above insights, Uber drivers in New York can know the best days, hours, and locations to get customers.
If we analyze the trend of number of Uber’s pickups over time, from April 2014 to Sept 2014, it is obvious that Uber is getting more and more popular over time.
+——————–+—-+—–+——+
| boro|year|month| count|
+——————–+—-+—–+——+
|Bronx …|2014| 4| 3314|
|Bronx …|2014| 5| 3922|
|Bronx …|2014| 6| 4411|
|Bronx …|2014| 7| 6195|
|Bronx …|2014| 8| 8010|
|Bronx …|2014| 9| 9670|
|Brooklyn …|2014| 4| 61840|
|Brooklyn …|2014| 5| 73608|
|Brooklyn …|2014| 6| 77839|
|Brooklyn …|2014| 7|105489|
|Brooklyn …|2014| 8|129725|
|Brooklyn …|2014| 9|146792|
|Manhattan …|2014| 4|454311|
|Manhattan …|2014| 5|517599|
|Manhattan …|2014| 6|517848|
|Manhattan …|2014| 7|603413|
|Manhattan …|2014| 8|596033|
|Manhattan …|2014| 9|762095|
|Queens …|2014| 4| 37134|
|Queens …|2014| 5| 48948|
|Queens …|2014| 6| 53136|
|Queens …|2014| 7| 67360|
|Queens …|2014| 8| 78675|
|Queens …|2014| 9| 90813|
|Staten Island …|2014| 4| 234|
|Staten Island …|2014| 5| 288|
|Staten Island …|2014| 6| 246|
|Staten Island …|2014| 7| 340|
|Staten Island …|2014| 8| 413|
|Staten Island …|2014| 9| 461|
+——————–+—-+—–+——+